The Pricing Procedure contains a lot of complexity within it and in a previous post Debug Pricing Procedures with Price Logs we took a look at the Pricing API execution log and the debug capabilities within it.
However to get the most detailed view of what is happening within the Pricing Procedure as it runs for a specific quote we can use the Simulate function within the Pricing Procedure. This provides for a specific referenced quote Id a full output of the JSON data points from start to finish of the Pricing Procedure.
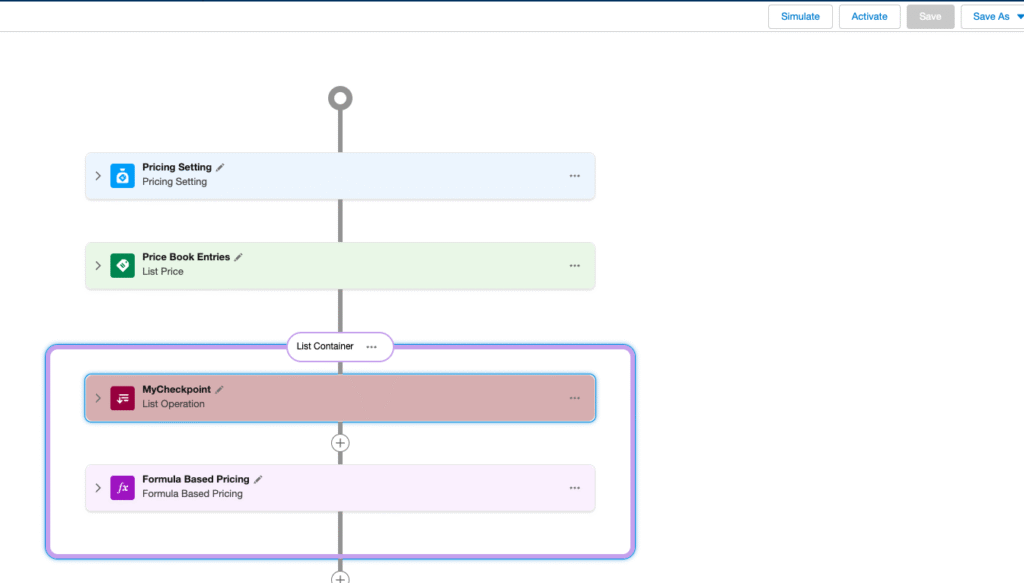
If we select the Simulate option from our Pricing Procedure
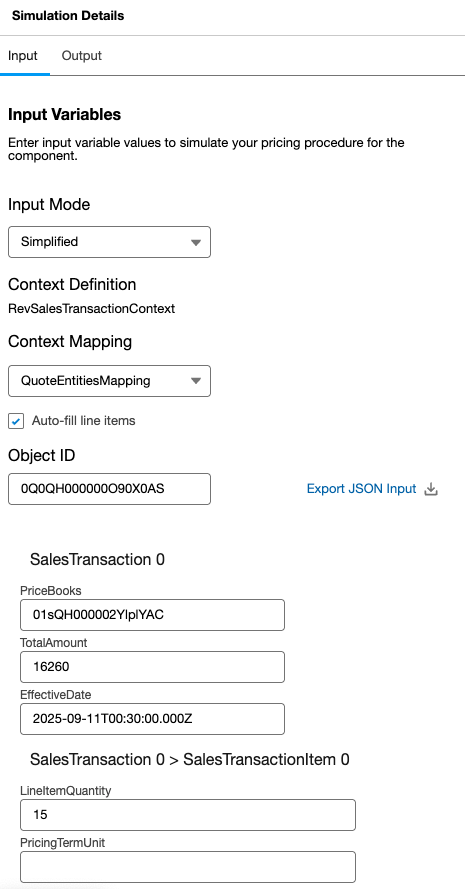
We can then either manually enter our JSON input values or we can pre-load the input based on a specific quote Id. There are a couple of input values which we still need to populate manually such as the effective date in the appropriate format.
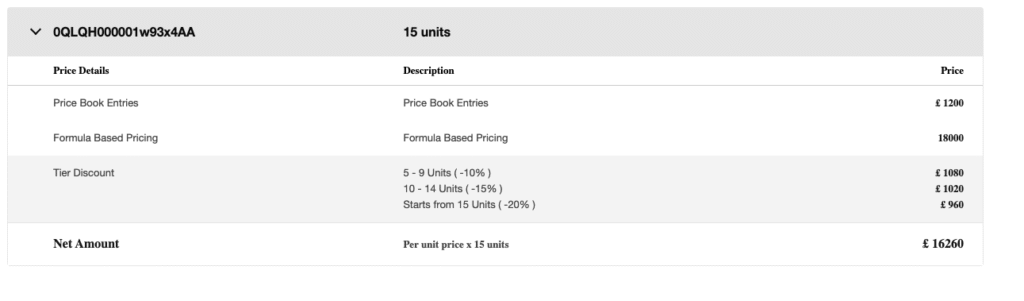
We can then run Simulate which produces a full JSON data trail of the Pricing Procedure execution, element by element plus a description of the price waterfall output.
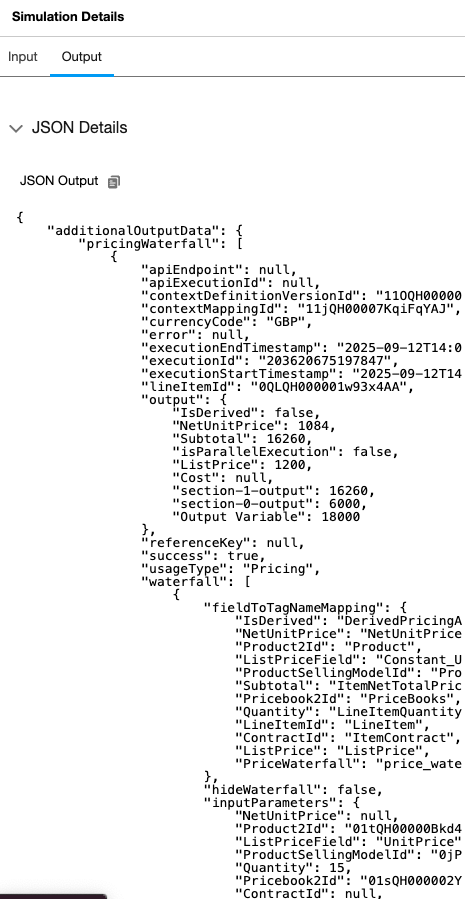
The entire JSON can be copied to the clipboard for dropping into your text editor for easier debugging.
Using the Simulator we can then debug our Pricing Procedure as we develop and customise it or troubleshoot any pricing issues we find while using it. This is a good example of the enterprise architecture within Revenue Cloud – transparency of the solution and support for industry development standards and techniques.